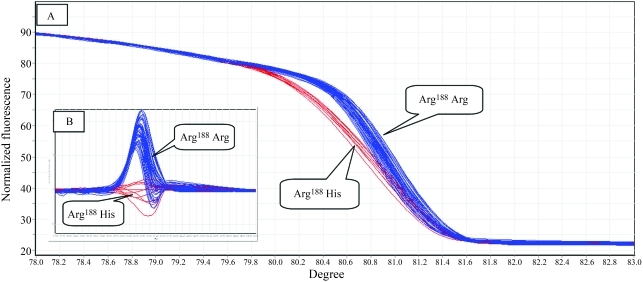
Figure 1.
(A) HRM curves for exon 3b (Ex3b) of the XRCC2 gene in patients and controls. The Arg188His genotype (red curves) was detected as a new melting curve group in a few patients and controls compared with the normal melting curves obtained for the wild type (Arg188) genotype (blue curves). (B) Difference graph of the HRM curves.

