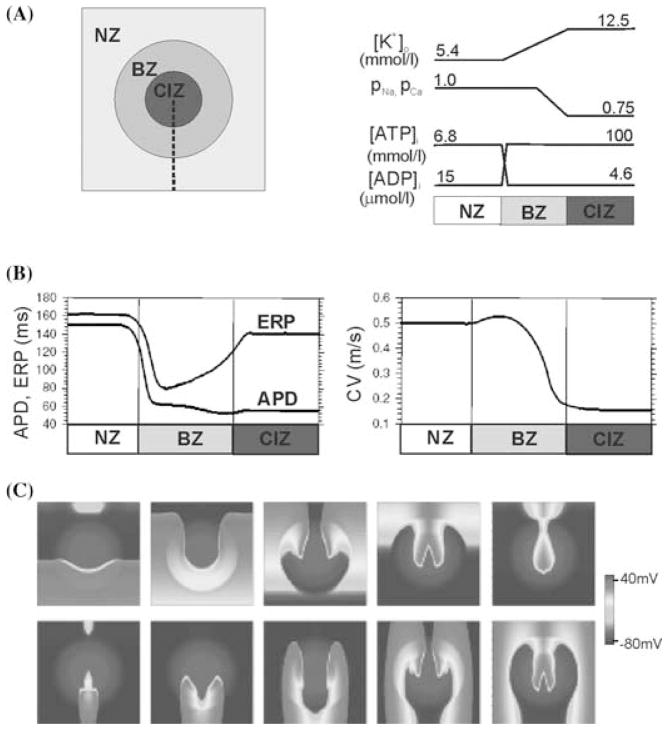
FIGURE 3.
Arrhythmogenesis in regional ischemia. Panel A: Schematic of the 2D model of regionally ischemic tissue (left) and the spatial variations in extracellular potassium concentration ([K+]o), intracellular ATP and ADP concentrations ([ATP]i and [ADP]i), and the degree of inhibition of the maximum conductances of the Na+ and Ca2+ currents in the central ischemic zone (CIZ), border zone (BZ), and normal zone (NZ) (right). Panel B: Spatial variation in the effective refractory period and action potential duration (left) and in the longitudinal conduction velocity (right) along the dashed line depicted in panel A, left. Panel C: Snapshots of transmembrane potential distribution at different instants of time following the delivery of a premature stimulus at CI = 210 msec in the lower part of the 2D sheet illustrated in panel A. Snapshots are separated by 50 msec; the first corresponds to 50 msec after the delivery of the premature stimulus. Panel C is shown in color online. (Modified from reference 47.)

