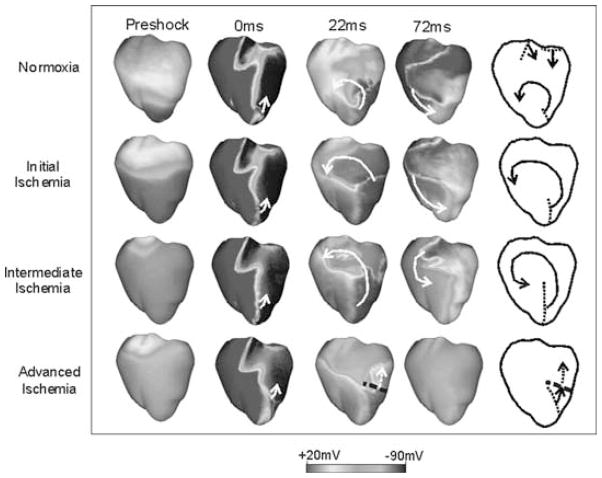
FIGURE 5.
Anterior transmembrane potential distribution in normoxia and global ischemia for a 6.4 V/cm shock applied at CI = 160 msec. Times refer to shock end. Color scale is saturated, that is, potentials above +20 mV and below −90 mV appear red and blue, respectively. Diagrams present major features of postshock behavior. Dotted lines indicate spatial extent of wavefronts at shock end. Solid arrows show direction of propagation. Dashed arrows depict direction of decremental conduction. Thick dashed lines mark locations at which conduction becomes decremental. The Figure is shown in color online. (Modified from reference 40.)

