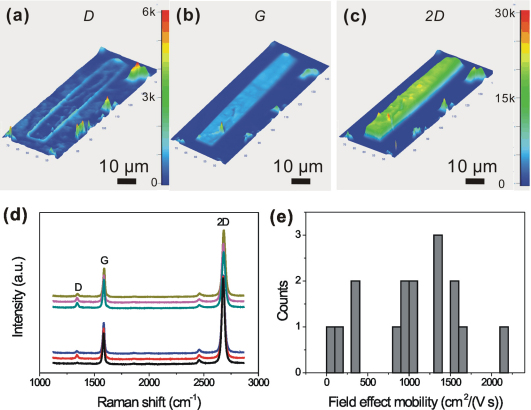
Figure 1. Basic investigation of the CVD-G samples: (a–c) Intensity maps of the D, G, and 2D bands, respectively.
Figure 1b and c share the same count scale. (d) Raman spectra of the same sample as Fig. 1a to c were collected from six typical spots far from the edge. (e) Statistic field effect mobility distribution for CVD-G devices.

