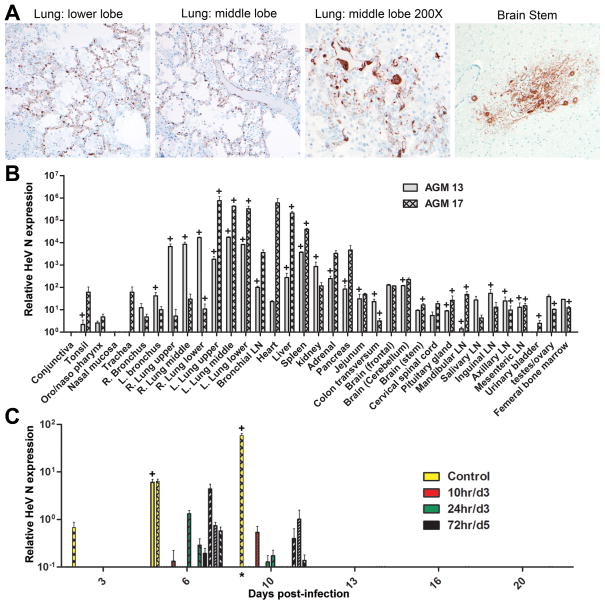
Figure 2. HeV antigen and viral RNA in untreated control AGM tissues and viral RNA in blood from m102.4 efficacy trial.
(A) Localization of HeV antigen by immunohistochemical stain in the lung and brainstem of AGM 13. Sections were stained with a NiV nucleoprotein (N) specific rabbit polyclonal antibody and images were obtained at an original magnification of at 40X; however one panel was photographed at 200X as indicated. (B) Detection of HeV RNA in tissues collected from AGM 13 and AGM 17. (C) Detection of HeV RNA in blood samples. RNA samples were assayed in triplicate using TaqMan PCR. Blood and tissue Ct values were analyzed against Ct values generated from a standard curve of HeV RNA, as described in the methods, and a relative HeV N expression value was calculated for each blood replicate. Results are shown as average relative HeV N gene expression levels. The data are mean +/− SD. In panel C data from individual subjects are shown and indicated as none or different hatched patterns, and bar coloration (inset legend) indicates the different treatment groups. Virus isolation was attempted on all tissue and blood samples, and positive samples are indicated by (+). The blood sample (*) from one control subject was a terminal sample taken on day 8; lymph node.

