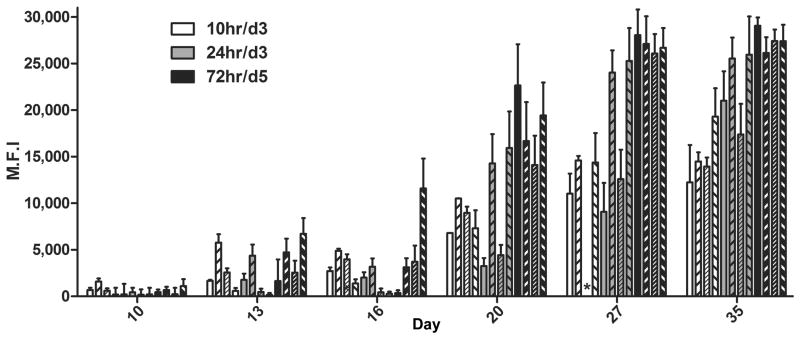
Figure 3. Detection of F-specific antibodies in m102.4 treated AGMs.
Median fluorescence intensities (M.F.I.) are shown on the Y-axis and represent binding to soluble F. Error bars represent the standard deviation of fluorescence intensity across 100 beads for each sample. Three of 4 subjects in the 10hr/d3 group were sampled on days 24 and 30 instead of days 27 and 35; the remaining animal (
 ) in this group was sampled on day 27 and 35. No sample (*) was collected for one animal (
 ) on day 24.

