FIG. 5.
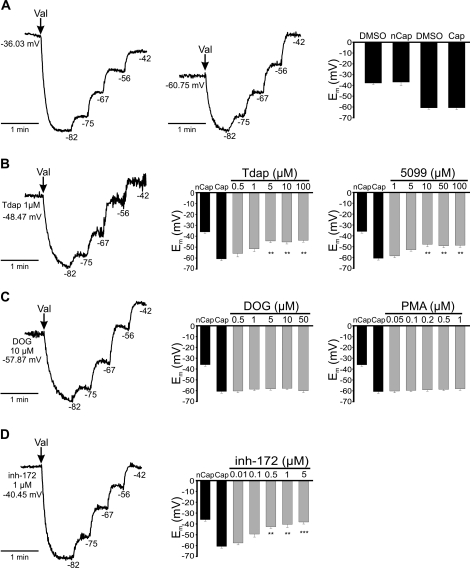
SLC26A3 and CFTR are involved in the capacitation-associated hyperpolarization. Membrane potential measurements in mouse spermatozoa using DISC3(5) 1 μM, as described in Materials and Methods. The traces on the left in all panels are representative fluorescence traces with internal calibration using valinomycin (val) and subsequent KCl additions to determine the Em in each condition. The numbers to the right of each KCl addition correspond to the estimated theoretical potential using the Nerst equation. A) Representative traces from noncapacitated spermatozoa (nCap) (left), capacitated spermatozoa (Cap) (middle), and summary of the results (right). Representative traces (left) from capacitated sperm in the presence of Tdap (B), DOG (C), and inh-172 (D) at the indicated concentration. Summary of the sperm Em (right) in control conditions (black bars, noncapacitated [nCap] and capacitated [Cap]) or in the presence during capacitation of SLC26A3 (Tdap or 5099), SLC26A6 (DOG or PMA), or CFTR (inh-172) inhibitors (gray bars) at the indicated concentrations. Results are means ± SEM. N.S., P > 0.05; **P ≤ 0.01; ***P ≤ 0.001 (n = 3).

