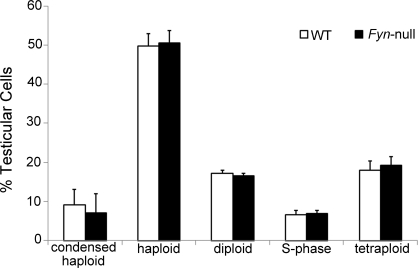
FIG. 2.
DNA flow cytometric analysis of Fyn-null testicular cell composition is shown. Fyn-null and WT testes (five testes from five mice in each group) were digested to single cells. Testicular cells were then fixed with ethanol and stained with PI. Flow cytometric analysis revealed five populations categorized according to cellular DNA content: condensed haploid (elongated spermatids), haploid (round spermatids), diploid (spermatogonia/somatic cells), S phase (S-phase spermatogonia), and tetraploid (primary spermatocytes/G2 spermatogonia). Percentages of each population (50 000 events per sample analyzed) in the Fyn-null testis were compared with those in the WT testis by t-test and found not to be significantly different (n = 5; P > 0.05). Bars indicate means ± SD.

