
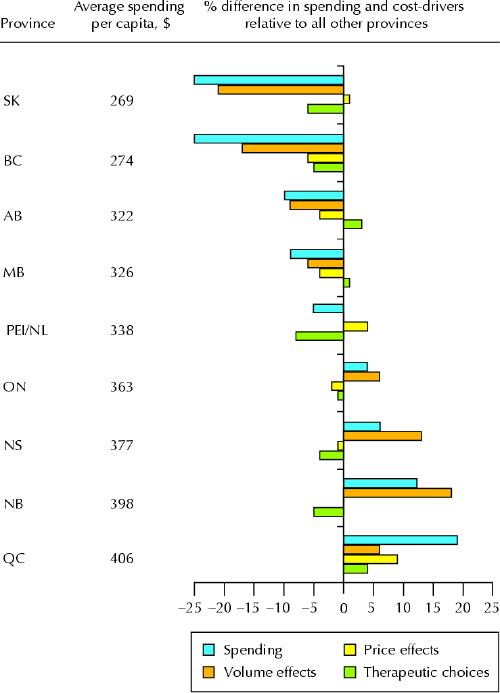
Fig. 1: Magnitude and determinants of interprovincial variation in per capita drug spending on oral solid prescription drugs, 2002. Cost-drivers are shown as volume effects, price effects and therapeutic choices. Volume effects represent differences in the number of prescriptions for oral solid drugs and in the average number of units dispensed per prescription. Price effects represent differences in unit prices for products already on the market and in cost savings from the use of generic drugs. Therapeutic choices represent differences in the choice of product class from which to prescribe and in the selection of specific drugs from within a class. Data are drawn from the Canadian CompuScript Audit (IMS Health, Canada). Data collected from 2100 retail pharmacies were projected by IMS Health to the population of each province, with the exception of PEI and Newfoundland and Labrador, whose data are combined in view of their smaller populations.