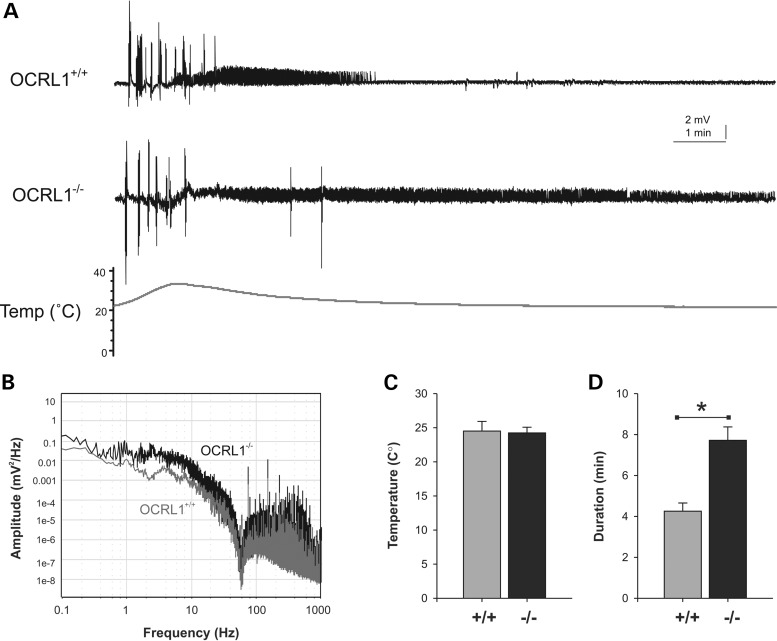
Figure 4.
Electrographic seizure activity in OCRL1 mutant zebrafish. (A) Representative recoding taken from the forebrain of parental OCRL1+/+ and OCRL1−/− mutant zebrafish embryos at 6 dpf. (B) Plot of amplitude versus frequency of recordings taken from OCRL1+/+ and OCRL1−/− embryos. (C,D) Plot of average temperature at onset of seizure (C) and duration of seizure activity (D) in OCRL1+/+ and OCRL1−/− embryos. Data are presented as mean + SEM (n = 23–30). *P < 0.001.

