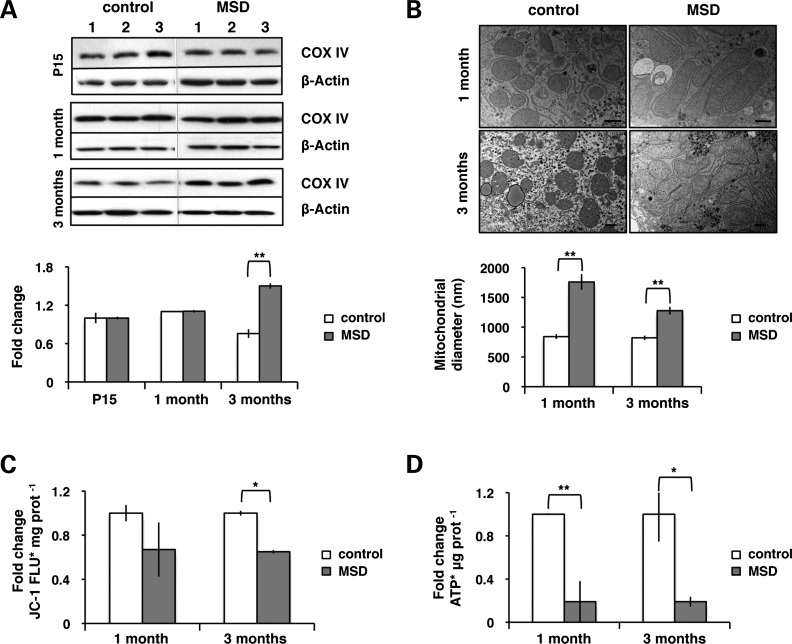
Figure 2.
Dysfunctional giant mitochondria accumulate in a time-dependent manner in MSD liver. (A) Levels of COX IV in liver total lysates of MSD (n = 3) and control (n = 3) mice at P15, 1 month and 3 months. The COX IV/actin ratio is expressed in terms of fold changes and represents an average value; **P < 0.01. (B) Analysis of mitochondrial size (diameter) using the AnalySIS software in liver ultrathin sections (70 nm) from MSD and control mice at 1 month and 3 months. Average number of mitochondria analyzed: control 1 month = 43, MSD 1 month = 56, control 3 months = 60, MSD 3 months = 127. Values are expressed in nm (scale bar = 400 nm). ANOVA P-value = 1.27 × 10⁻¹³, **P < 0.01. (C) Measurement of JC-1 fluorescence (FLU) per milligram (mg) of protein in isolated mitochondria from MSD (n = 3) and control (n = 3) mice at 1 month and 3 months. Values are expressed in terms of fold changes compared with control. ANOVA P-value = 0.048, *P < 0.05. (D) Analysis of ATP content per microgram (μg) of protein in isolated mitochondria from MSD (n = 3) and control (n = 3) mice at 1 month and 3 months. Values are expressed in terms of fold changes compared with control. ANOVA P-value = 4.81 × 10⁻³, *P < 0.05, **P < 0.01.

