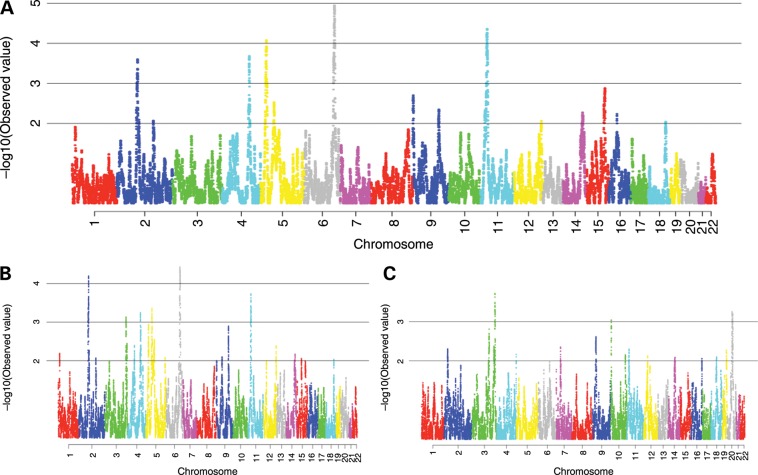
Figure 1.
Results of breast cancer admixture mapping. On the X-axis are genomic positions by chromosome. On the Y-axis are the negative log10 P-values for the association between locus-specific ancestry and breast cancer risk. (A) Admixture mapping for Indigenous American component. (B) Admixture mapping for European component. (C) Admixture mapping for Africa component.

