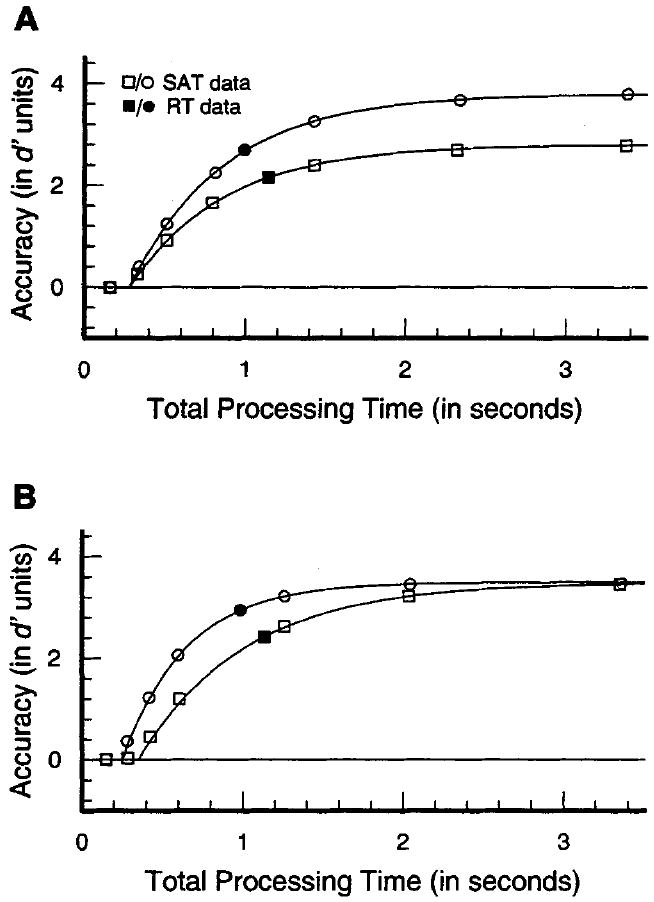
Figure 1.

Hypothetical speed–accuracy trade-off (SAT) functions illustrating two conditions that differ by SAT asymptote only (Figure 1A) or SAT intercept and rate (Figure 1B). The filled symbols show (hypothetical) reaction time (RT) points plotted in SAT coordinates (see text), illustrating that approximately the same difference in mean RT and RT accuracy is consistent with either differences in SAT asymptote (Figure 1A) or SAT dynamics (Figure 1B).
