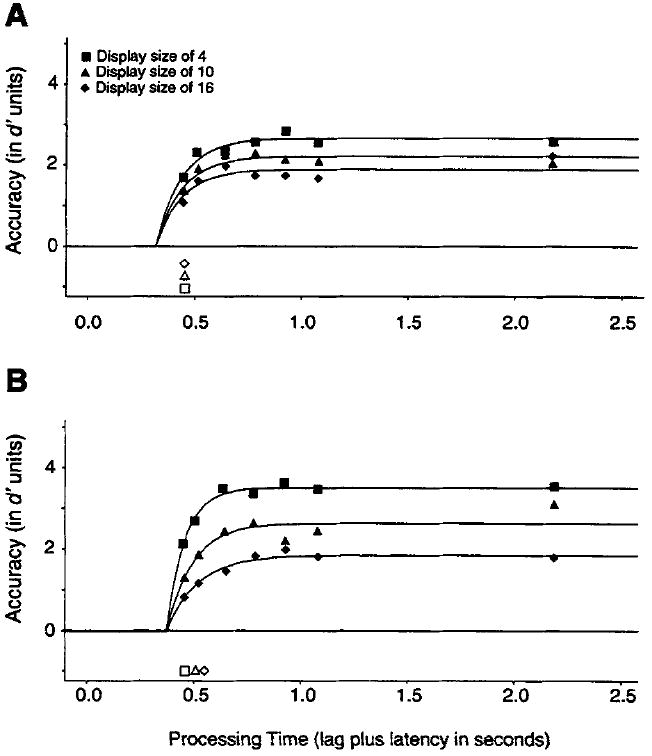
Figure 5.

Average d′ accuracy (symbols) as a function of processing time (lag of the response cue plus latency to respond to the cue) for different set sizes for feature (Figure 5A) and conjunction (Figure 5B) searches under the fixed-viewing conditions (150-ms stimulus duration) of Experiment 2. Smooth curves show the best fits of Equation 3 with the (average) parameters listed in Table 1. Open symbols show the point in time when the corresponding functions reach two thirds of their asymptote.
