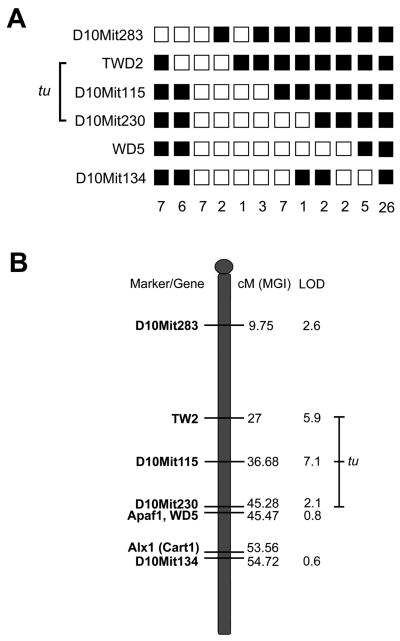
Figure 8.
Linkage map of a putative tuft locus on Chromosome 10. Genotype of microsatellite markers in 73 affected tuft N2 mice from a cross between 3H1 tuft and BALB/c (A) Each column represents a haplotype of Chr 10 markers. Filled boxes represent homozygosity for the 3H1 tuft allele and open boxes represent heterozygosity for the BALB/c allele. The number of mice with each haplotype is indicated at the bottom. Genotypes for four of the haplotypes were incomplete and remained uninformative, thus were not included. The range bar indicates a candidate region for the tuft locus. (B) Map of Chr 10 with putative tuft locus. From left to right, microsatellite markers and relevant genes, distance from the centromere in centiMorgans (cM) as reported by the Mouse Genome Informatics (MGI, 2011), and LOD scores. The range bar indicates the putative tuft locus between TWD2 and distal D10Mit230 markers.

