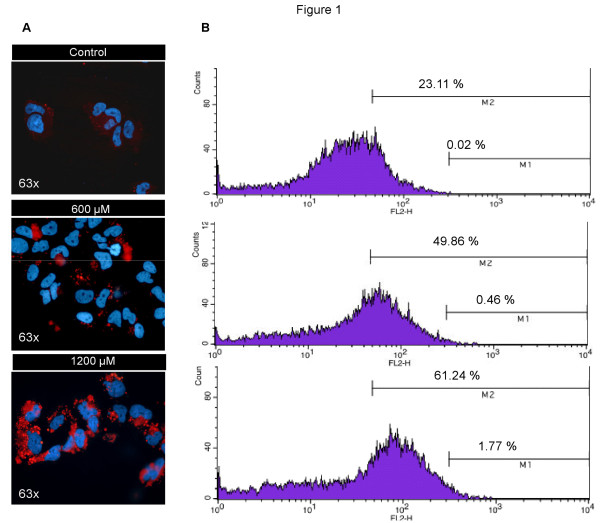
Figure 1.
Dose dependent intracellular fat accumulation. Cell exposure to 600 and 1200 μM FFA for 24 h. Dose dependent intracellular fat accumulation evidenced by Nile Red staining assessed by fluorescence microscopy (A) and flow cytometry measured in 1 × 10⁴ cells (B), M1 represents the percentage of events above the maximum value of fluorescence and M2 represents the percentage of events above the median value of fluorescence.

