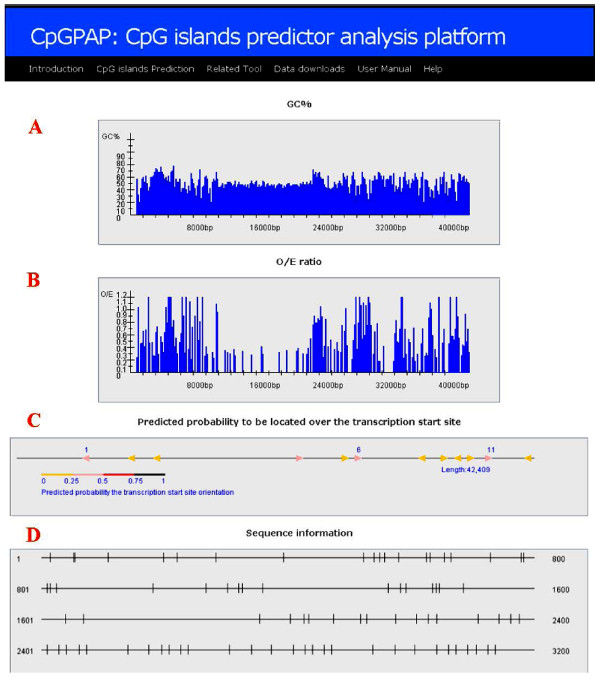
Figure 3.
Visualization of the CpG island prediction results. A: GC% chart shows the GC content distribution in the input sequence. B: O/E ratio chart shows the O/E ratio distribution in the input sequence. C: TSS chart shows the probability of the predicted CpG island overlapping with a transcription start site. D: CpG chart shows the CpG nucleic and CpG island distribution

