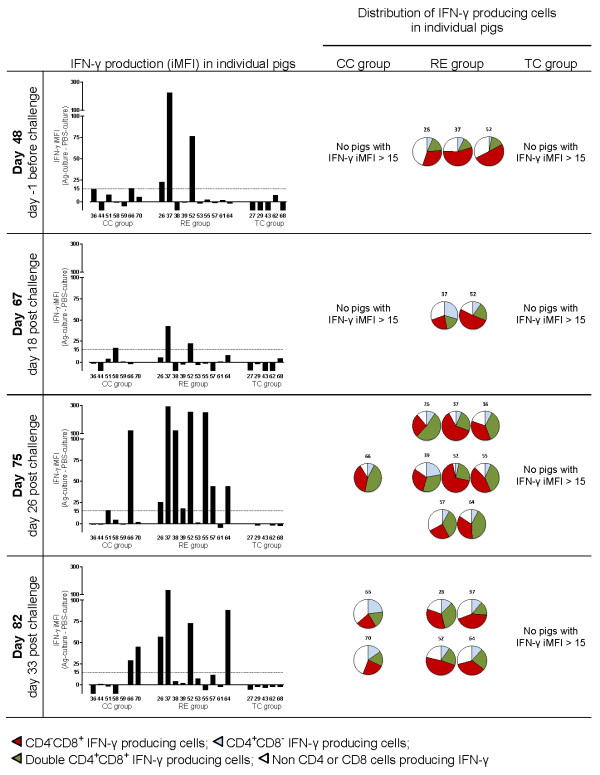
Figure 4.
Phenotypes of L. intracellularis-specific IFN-γ producing cells. Flow cytometry characterization of L. intracellularis specific IFN-γ producing cells in individual pigs from the RE group, TC group and CC group, measured before challenge (day 48) and after challenge (day 67, 75, and 82). Bars show levels of IFN-γ responses in lymphocytes (iMFI (Ag-culture) subtracted iMFI (PBS-culture)), and for iMFI > 15, the distribution of IFN-γ producing cells in Ag-cultures are shown.

