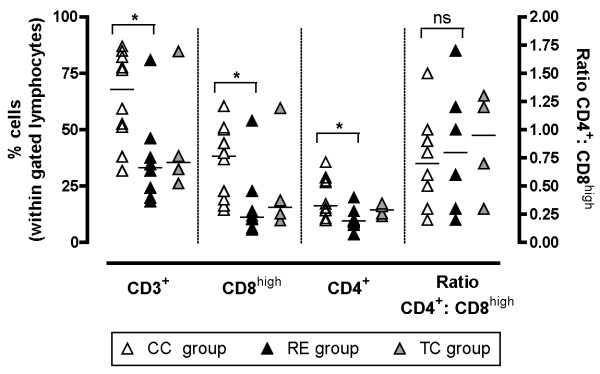
Figure 6.
Distribution of T cell subsets isolated from lamina propria. Distribution of lamina propria T cell subsets 3 weeks pi analysed by flow cytometry within a tight gate of lymphocytes defined from forward and side scatter profile. Bars indicate median value. * indicates P < 0.05 (Mann-Whitney).

