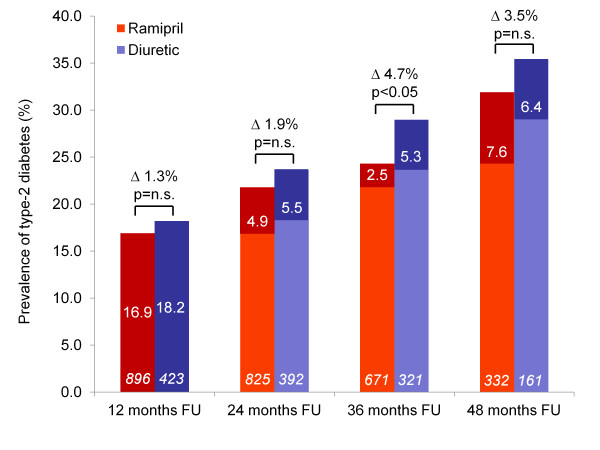
Figure 1.
Prevalence of new-onset diabetes in patients during the 4 year follow-up. Legend: White numbers within columns indicate yearly incidence rates, patient numbers in italics; further differences between diabetes prevalence rates for each year are indicated together with the result of statistical testing.

