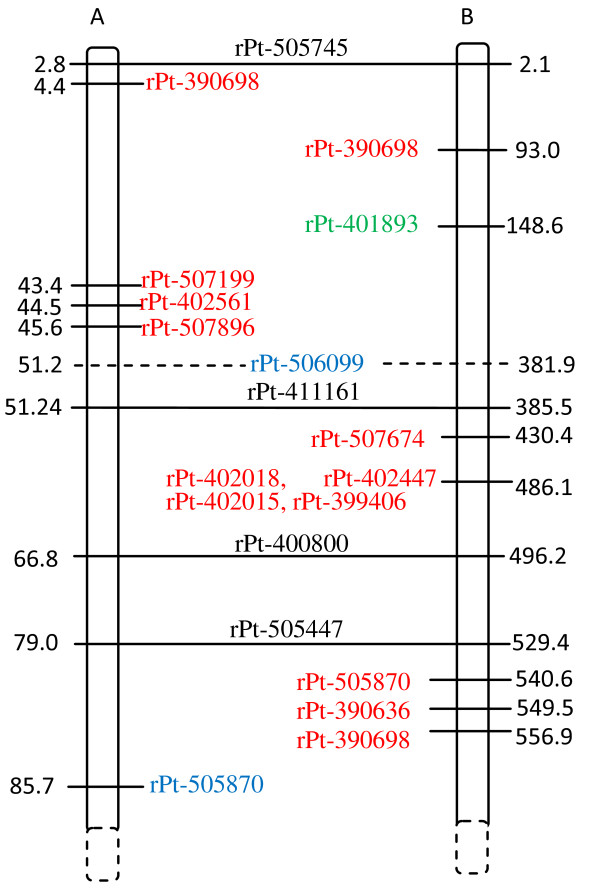
Figure 3.
Alignment of triticale (A) and rye (B) 6R genetic maps. The associated markers and those belonging to the same redundant marker bin(s) (see also Table 3) are indicated in red. Markers in green correspond to genomic regions under putative positive selection, while those in blue are from regions under balancing selection. Markers common to both maps are shown in dark and are linked by horizontal lines. The distance is given in cM.

