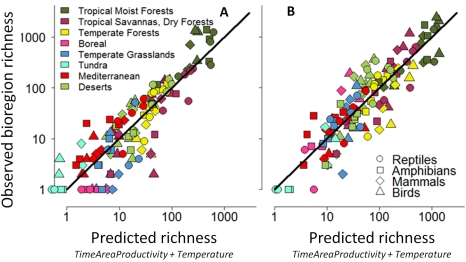
Figure 2. Observed versus predicted bioregion species richness of terrestrial vertebrates.
Observed bioregion species richness (A, Endemic species, B, Resident species) is plotted against that predicted by the two-predictor TimeAreaProductivity+Temperature model fit separately for each of the four taxa (different symbols). Lines indicate least squares fit of regressions relating to observed predicted richness for each of the four taxa over the 32 bioregions (r 2 [Endemic] = 0.78, r 2 [Resident] = 0.78, N = 128). For detailed results, see Table S7. Colors indicate biome membership (see the map in Figure 1 to match colors).

