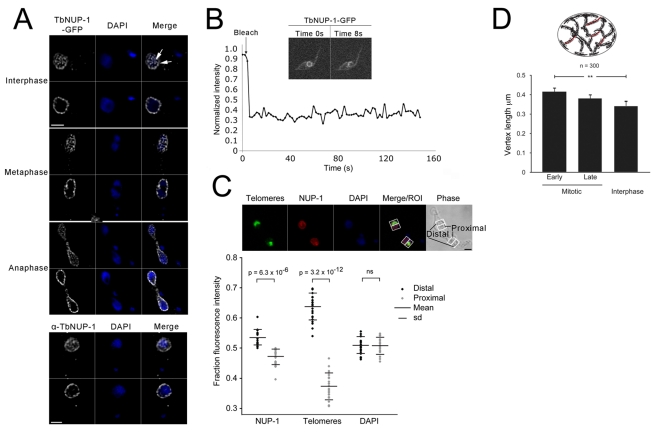
Figure 2. NUP-1 localizes to a stable network around the periphery of the nucleus.
(A) Fixed PCF cells expressing NUP-1-GFP (white) or BSF cells probed with an anti-NUP-1 antibody (white) were imaged by confocal microscopy. Shown are optical sections of the edge and centre of nuclei taken from image series along the z-axis. DAPI was used to visualize the DNA (blue). Bar: 2 µm. Arrowheads at right panel indicate two putative puncta (i.e., foci of NUP-1 reactivity from which linear regions of NUP-1 reactivity emanate). See also Movies S1A–D. (B) FRAP of NUP-1-GFP. After bleaching a portion of the nucleus, no fluorescence recovery was observed during 150 s. See also Movie S5. (C) Top: Cells were probed with an anti-NUP-1 antibody (red) and FISH for telomeres (green). DAPI was used to visualize DNA. Nuclei of dividing cells were sectioned into proximal and distal halves for analysis based on the position of telomeres. Bar: 2 µm. Bottom: Fluorescence intensity in confocal nuclear sections of 21 dividing nuclei was recorded for NUP-1, telomeres, and DAPI and plotted as a fraction of the total fluorescence in each nucleus. Means and standard deviations (SD) are shown. The Student's paired t test was used to determine the p value of the fluorescence difference in the proximal compared to the distal half of the nucleus. NS, not significant. (D) Distance between NUP-1 puncta was measured using Metamorph software in cells that were in interphase (1K1N) or early or late mitotic (2K1N). Diagram at top illustrates the measurements taken, essentially of the inter-puncta distance (red). A total of 300 cells were analysed, and the statistical significance calculated using a Student's paired t test (p>0.01).

