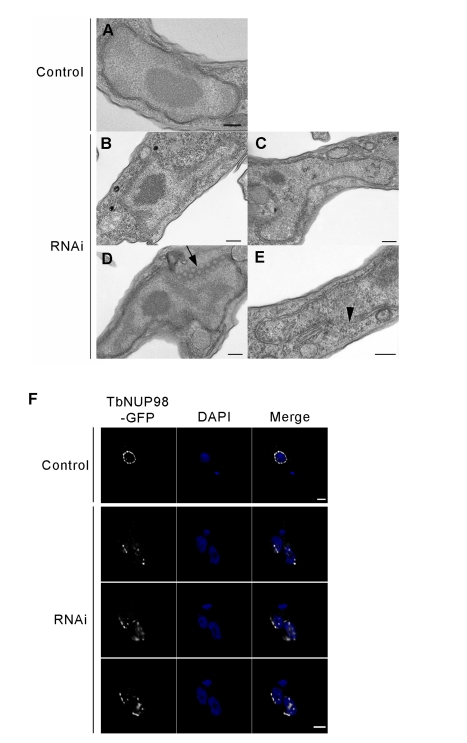
Figure 5. Nuclear morphology and NPC positioning are dependent on NUP-1.
(A) Control cell nucleus. (B–C) Nuclear morphology disruption in NUP-1 RNAi cells, with nuclei producing asymmetric extensions and/or invaginations. (D) NPC arrays (black arrow) are visible. (E) Areas of the nuclear envelope appeared ill-defined (black arrowhead). Bar: 200 nm. (F) TbNUP98-GFP (white) was used as a marker of the NPC and in control cells displayed as puncta around the nuclear periphery (top panel). In NUP-1 RNAi cells, NPCs clustered in distinct regions of the nuclear periphery (bottom panels, serial images along the z-axis). DAPI was used to visualize DNA (blue). Bar: 2 µm.

