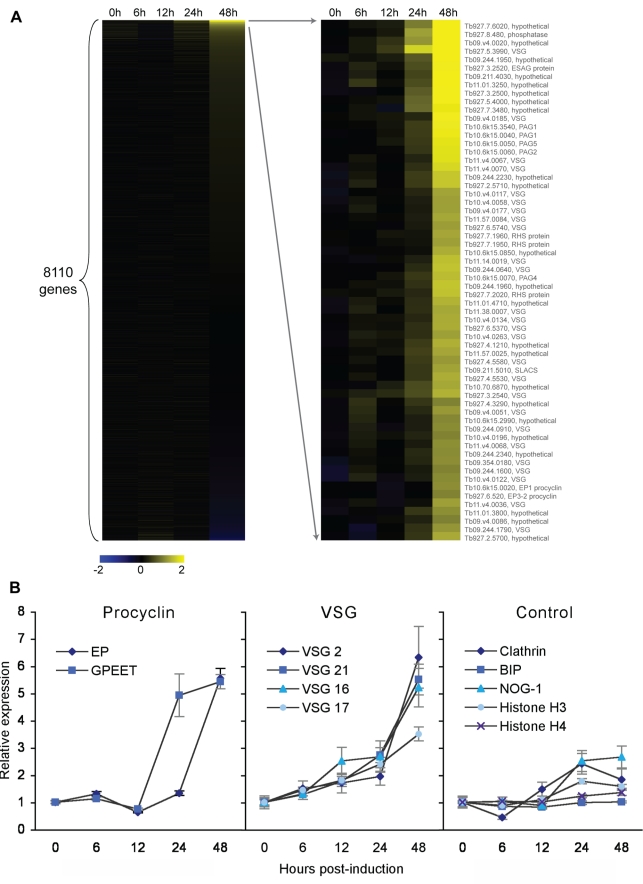
Figure 8. NUP-1 depletion causes increased expression of developmentally regulated genes in BSF cells.
(A) Heatmap for microarray following NUP-1 knockdown in BSF cells. Of 8,110 genes, 62 were increased in relative expression greater than 2-fold. Yellow and blue represent upregulation and downregulation, respectively, and black no expression change. Gene accession numbers/annotation are given for the upregulated genes. (B) qRT-PCR quantitation of the expression of EP and GPEET procyclin genes (left panel), selected ES VSG genes (middle panel), and housekeeping genes (right panel) during NUP-1 RNAi. The expression level in control cells was set to one, and y-axis is the relative expression compared to control cells, normalized to β-tubulin.

