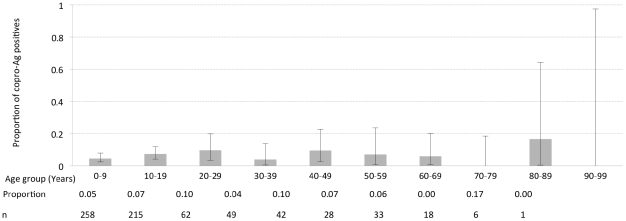
Figure 3. Taeniosis prevalence per age group.
Results of the copro-Ag ELISA in a function of the 10 age groups of 10 years each. The upper and lower 95% exact binomial confidence intervals for the prevalence in each age group are represented through error bars. The proportion of positives and number of individuals sampled in each age group are also shown.

