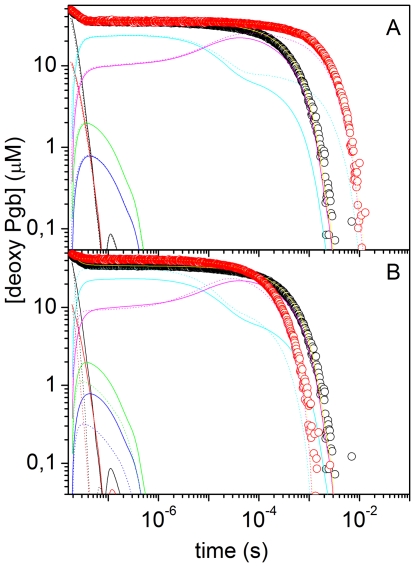
Figure 7. Representative analysis of CO rebinding kinetics to MaPgb*.
(A) Analysis of the CO rebinding kinetics to MaPgb* in solution equilibrated at 10°C with 1 atm CO (black circles) and 0.1 atm CO (red circles). The fits (yellow lines) are superimposed to the experimental data (circles). In the figure we have also reported the time course of the other relevant species in Scheme 1 of main text: (MaPgb*r:CO)1 (black), (MaPgb*t:CO)1 (red), (MaPgb*r:CO)2 (green), (MaPgb*t:CO)2 (blue), (MaPgb*r) (cyan), (MaPgb*t) (magenta). Solid lines, 1 atm CO; dotted lines, 0.1 atm CO. (B) Analysis of the CO rebinding kinetics to MaPgb* in solution equilibrated with 1 atm CO at 10°C (black circles) and 25°C (red circles). The fits and the time courses of the other relevant species are also displayed with the same color code as in Panel A (solid lines, 10°C; dotted lines, 25°C).

