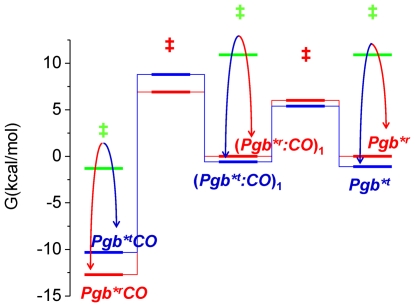
Figure 9. Free energy plot.
The free energy plot for reaction Scheme 1 as calculated from activation free energies for the forward and reverse rate constants reported in Table 1. Transition states are labelled as ‡. Transitions between r and t conformations are indicated from curves with arrows. Solid lines (red, r; blue, t) connect states within each conformation.

