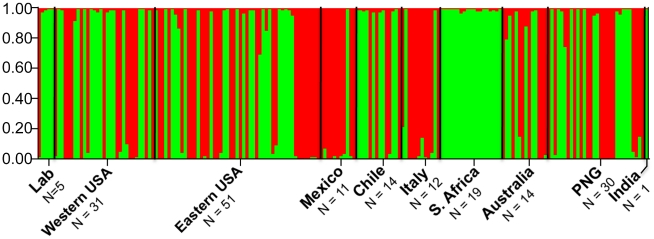
Figure 1. Two cluster population structure of T. vaginalis.
A Bayesian clustering model implemented in STRUCTURE 2.2 indicates a two-cluster population structure for T. vaginalis (N = 188). The green cluster (type 1, (N = 95)) and red cluster (type 2, (N = 93) are found in each geographical location, with the exception of Southern Africa where all samples are type 1, and Mexico, which has a statistically significant over-representation of type 2. PNG: Papua New Guinea. Isolates included in each geographical location can be found in Table S1.

