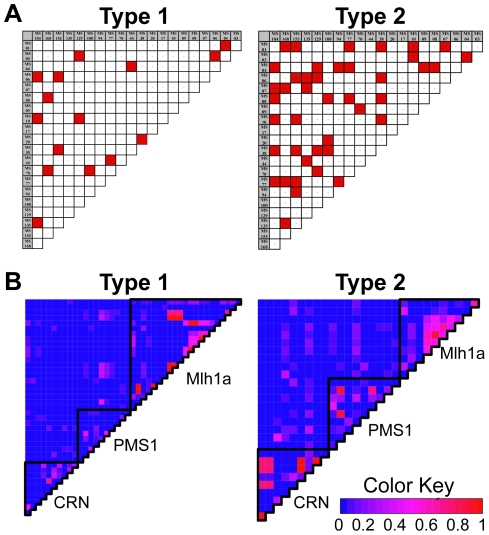
Figure 3. Linkage disequilibrium varies between type.
(A) Pairwise linkage disequilibrium (LD) matrix for MS genotypes of type 1 (N = 95) and 2 (N = 93). Significant LD is highlighted in red. Type 2, with 42 cases of paired locus LD, shows a greater amount of LD in comparison to type 1 with 15 cases. (B) Heat maps indicating degree of LD between SNPs in single copy genes. Gene boundaries are indicated by black lines. The number of pairwise comparisons varies between the two types due to the difference in the number of polymorphisms analyzed, but a greater amount of pairwise LD in type 2 in comparison to type 1 is indicated.

