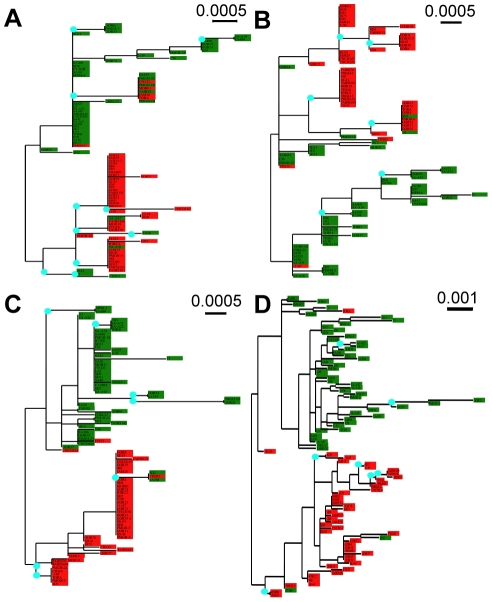
Figure 4. Phylogenies of single-copy genes.
Phylogenetic trees were inferred from the DNA sequences for each of the three single copy genes (A) CRN (N = 94), (B) PMS1 (N = 94), and (C) Mlh1a (N = 94), and from the concatenation of all the three genes (N = 94; D). Blue dots indicate nodes where bootstrap support is ≥50. The clustering of type 1 (green) and type 2 (red) isolates supports the two-type population structure. Instances of unlike clustering resulting in non-homologous tree topology provide possible evidence for cases of recombination.

