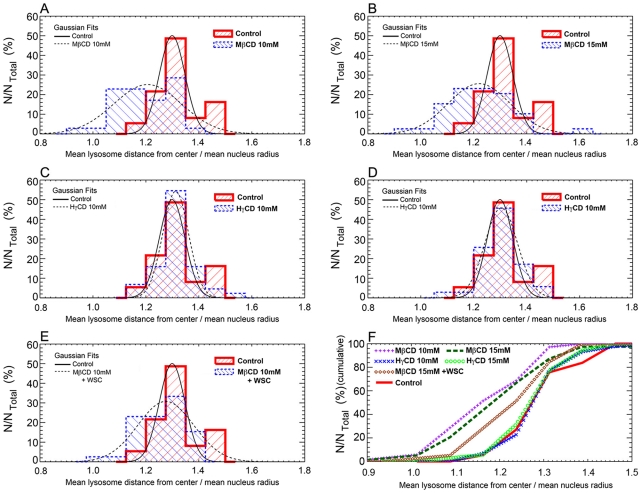
Figure 7. MβCD but not HγCD cell treatment leads to diminishment in lysosomal distribution near cell cortex.
Quantitative analysis of lysosomal distribution, relative to cell nuclei, in 10 mM MβCD (A), 15 mM MβCD (B), 10 mM HγCD (C), 15 mM HγCD (D) or 15 mM MβCD followed by incubation with 0.05 mM WSC (E), treated cardiomyocytes in comparison to control non-treated cells. The mean distance between a lysosome and its respective cell center is represented by letter (D) and the mean lysosome distance (D) relative to the mean nucleus' radius (R) was defined as the ratio D/R. Ratio values closer to one indicate lysosomes are close to perinuclear region whereas the opposite indicate lysosomes are more frequent at cell borders. This ratio D/R was measured for several groups of lysosomes associated with each nucleus in the different treatments. The results of this analysis are distributions of D/R values associated to each drug treatment, and are represented as histograms. The histogram for each specific drug treatment is represented with a blue dashed line, which is superposed to the control (non-treated) lysosomal distribution, represented with a red solid thick line. Overlaid Gaussian fits to each distribution were added in order to highlight the main statistical trend of each diagram. The x-axis of each graph represents the ratio D/R whereas the y-axis represents the percentage of analyzed nuclei from each treatment normalized by total cell number. (F) Cumulative frequency of the histograms. Purple plus signs represent MβCD 10 mM treated cells, dark green rectangles represent MβCD 15 mM treated cells, blue crosses represent HγCD 10 mM treated cells, light green circles represent HγCD 15 mM treated cells, brown diamonds represent cells replenished with cholesterol after previous depletion and red continuous line represent control untreated cells. The Kolmogorov- Smirnov (KS) statistical test was performed to compare the cumulative frequency distributions. Statistically significant differences were obtained for MβCD 10 mM 0.02% (p = 0.0002) or MβCD 15 mM 0.03% (p = 0.0003) treated cells in relation to control, but not for HγCD 10 mM 79.49% (p = 0.7949), HγCD 15 mM 86.03% (p = 0.8603), or MβCD 15 mM + WSC 6.44% (p = 0.0644) treated cells in relation to control.

