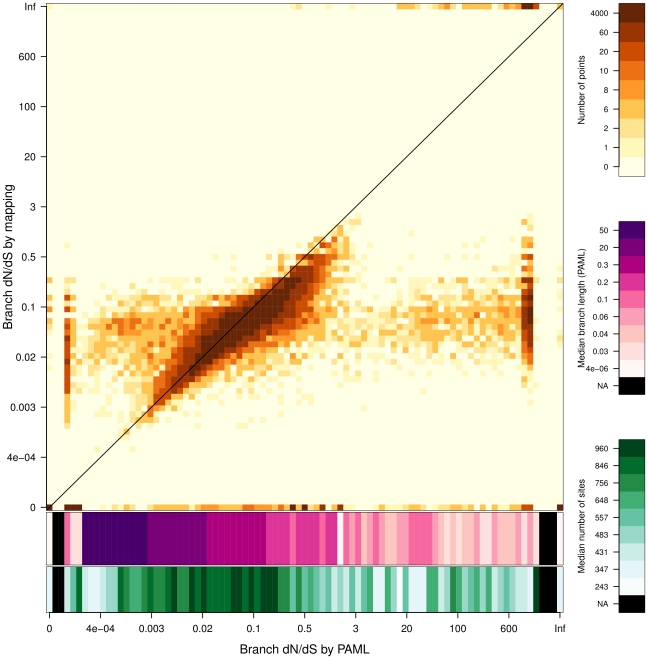
Figure 5. Estimation of dN/dS values by substitution mapping compared with dN/dS values estimated by PAML.
Axes are in log scale. The orange color gradient represents the density of points. The two scales in purple and green show the median branch length (estimated by PAML) and the median number of sites for corresponding dN/dS values estimated by PAML. The 0 value includes estimations where dN is equal to 0 and estimations where dN and dS are both equal to 0 (0/0).

