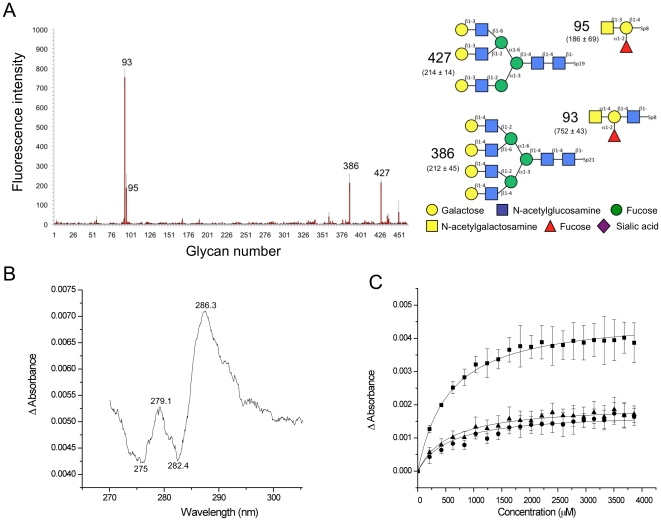
Figure 2. Analysis of carbohydrate binding by CBM32-5.
(A) Glycan microarray analysis of carbohydrate binding by CBM32-5. The carbohydrates giving the most significant signals are numbered and their structures are shown schematically to the immediate right. The fluorescence intensities measure for the glycans are shown with the structural schematics. The reported error represents the standard error of the mean for quadruplicate measurements. A legend to symbols representing specific monosaccharides is provided. (B) UV difference spectrum upon CBM32-5 binding to excess galactose. Wavelengths of peaks and troughs are labeled. (C) Binding isotherm of CBM32-5 binding to galactose generated by UV difference titrations. The squares, triangles and circles represent the values for the peak to trough height differences for the wavelength pairs of 287.2/282.4 nm, 279.1/275.3 nm, and 279.1/282.4 nm, respectively. The error bars represent the standard deviations from triplicate independent titrations. The solid lines show the fits to a one-site binding model.

