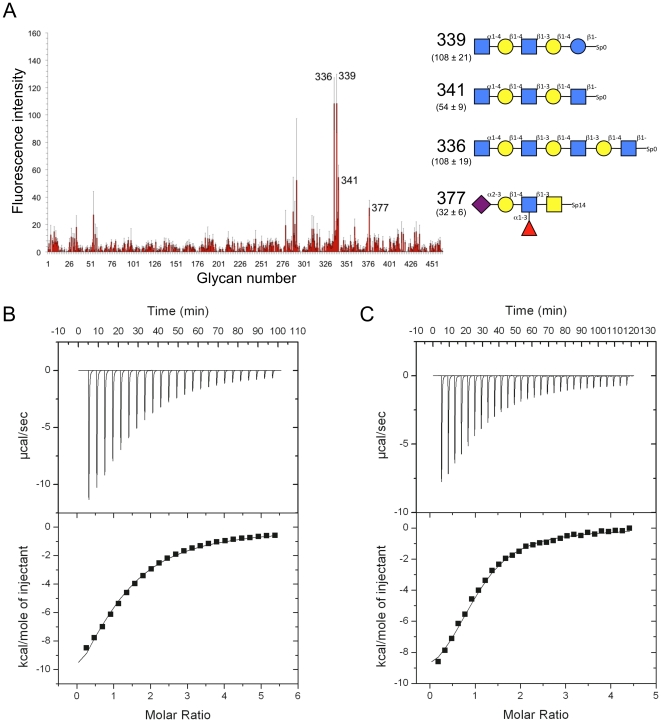
Figure 6. Analysis of carbohydrate binding by CBM32-3 and CBM32-4.
(A) Glycan microarray analysis of carbohydrate binding by CBM32-3. The carbohydrates giving the most significant signals are numbered and their structures are shown schematically to the immediate right. The fluorescence intensities measured for the glycans are shown with the structural schematics. The reported error represents the standard error of the mean for quadruplicate measurements. The symbols representing specific monosaccharides are the same as those given for Figure 2A. (B) and (C) Representative isothermal calorimetry titrations of CBM32-4 and CBM32-3, respectively, binding to GlcNAc-α-1,4-Gal. Top portions of each panel show the raw power data while the bottom portions show the integrated and heat of dilution corrected data. Solid lines show the non-linear curve fits to a one site binding model.

