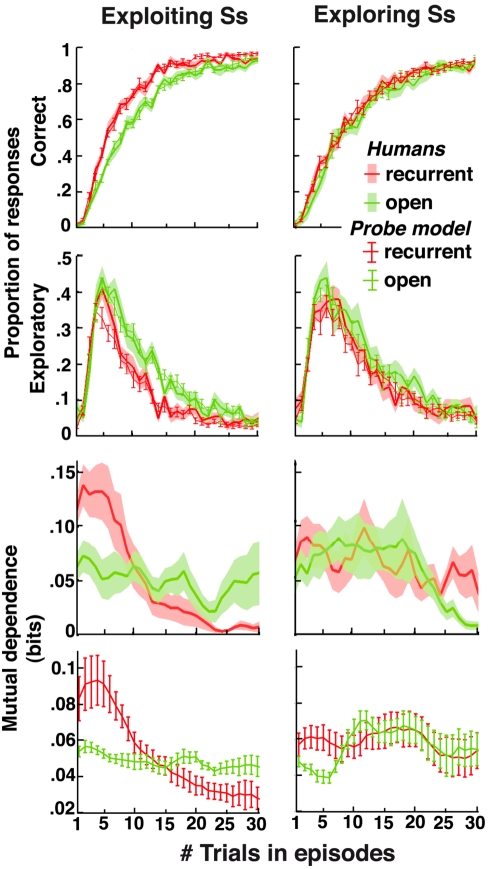
Figure 6. Individual differences in decision-making with no contextual cues.
Correct and exploratory response rates as well as mutual dependence of successive correct decisions in recurrent (red) and open (green) episodes plotted against the number of trials following episode onsets (data from Experiment 1). Lines ± shaded areas (mean+S.E.M.): participants' performances. Lines ± error bars (mean ± S.E.M.): predicted performances from the fitted PROBE model. Predicted correct and exploratory response rates were computed in every trial according to the actual history of participants' responses. Predicted mutual dependence of successive correct decisions was computed as the mutual information between two successive correct responses produced by the model independently of actual participants' responses (one simulation for each participant). Left, exploiting participants: Correct responses increased and exploratory responses vanished faster in recurrent than open episodes (Wilcoxon-test, both zs>2.8, ps<0.005). Right, exploring participants: performances were similar in recurrent and open episodes (correct and exploratory responses: Wilcoxon-test, both zs<1.4, ps>0.17). See Table S2 for fitted model parameters in each group. See Text S1 for the discrepancy observed in Trial 5 between exploiting participants' exploratory responses and model predictions in recurrent episodes (section “Data Analyses”).

