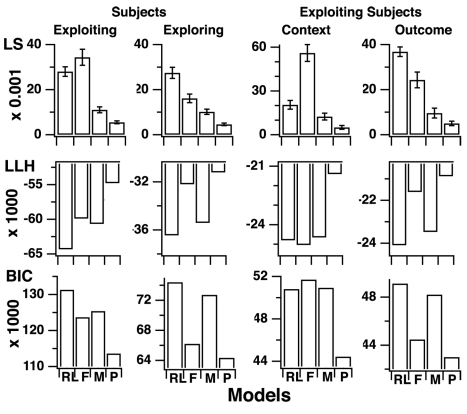
Figure 8. Comparison of model fits according to individual differences.
Least square residuals (LS), maximal log-likelihoods (LLH), and Bayesian information criteria (BIC) obtained for each model in exploring versus exploiting participants (left) and in context- versus outcome-exploiting participants (right). RL, reinforcement learning; F, FORGET; M, MAX; P, PROBE model. See details in the Figure 2 legend. Note that in every participants' group, the PROBE model was the best fitting model for every fitting criterion (LS, all Fs>4.2, ps<0.001 in exploiting and exploring groups; Wilcoxon tests in context- and outcome-exploiting groups, all zs>2.0, ps<0.047).

