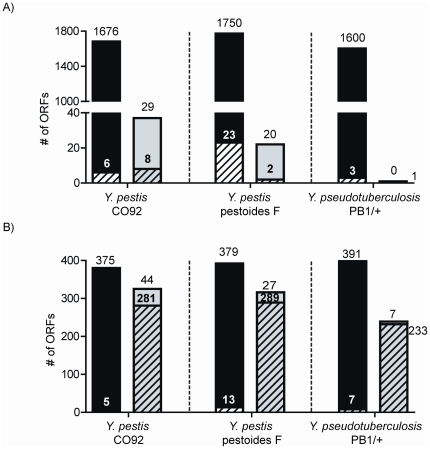
Figure 3. Categorization of experimental evidence.
Preliminary analysis shows the distribution of peptide and oligo evidence across annotated open reading frames (ORFs) (i.e., predicted proteins) in black and unannotated ORFs in grey. Solid regions indicate ORFS with complementary oligo and peptide evidence and hashed regions show ORFs with only peptide evidence. A) shows ORFs exhibiting two or more unique non-redundant peptides and B) shows ORFs exhibiting a single unique non-redundant peptide.

