
Figure 6.
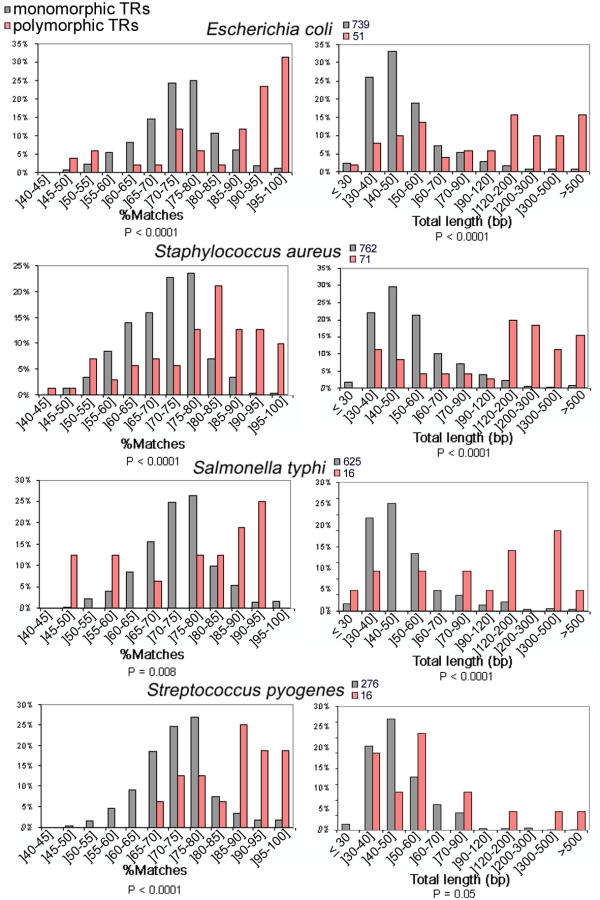
Proportion of predicted polymorphic (pink) and monomorphic (grey) tandem repeats according to different parameters (internal homogeneity of the repeat array (%matches) or total length). P-values obtained for the non-parametric Wilcoxon tests appear below each histogram.