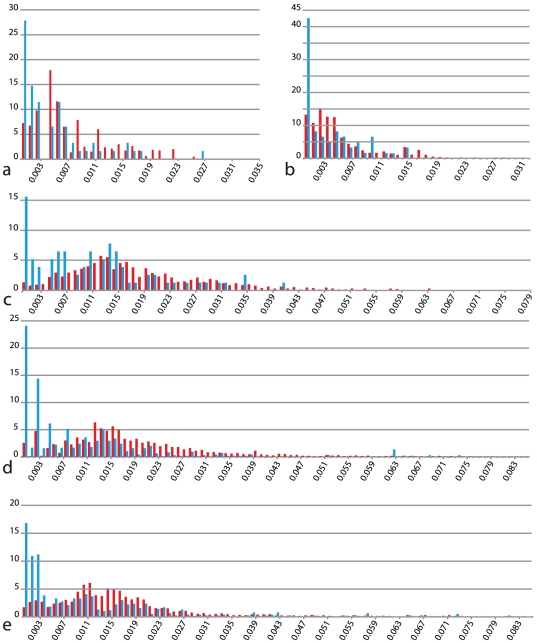
Figure 1. Intraspecific (blue) and interspecific (red) rates of substitution per 100 sites for each cpDNA region tested.
X-axis is K2P substitution rate. Y-axis is relative frequency within each dataset. a, matK dataset; b, barcode option 1 (rpoC1, rpoB and matK); c, barcode option 2 (rpoC1, matK and trnH-psbA); d, trnH-psbA; e, rpl32-trnL.

