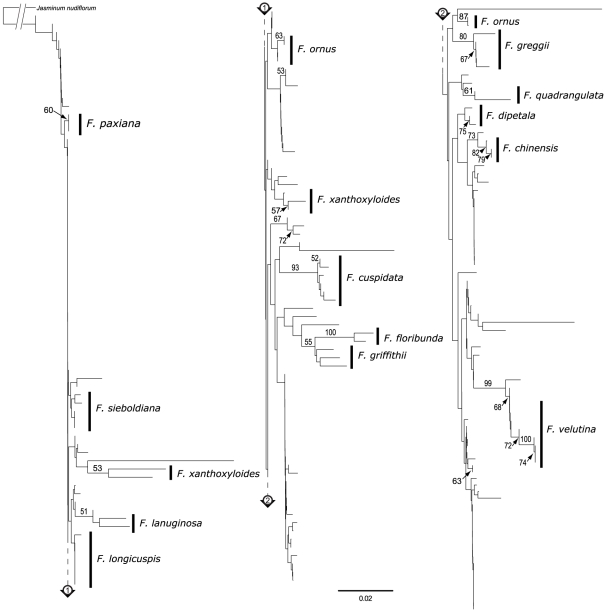
Figure 4. NJ tree of pairwise K2P substitution rates for the trnH–psbA dataset implicating the expanded dataset.
Bootstrap values of 50% and above are shown on the branches. Species that were potentially well-delineated with these sequences are marked by a black vertical line. Individuals marked by asterisks were likely misidentified, and not considered in species delineations. The scale bar represents the substitution rate per 100 sites.

