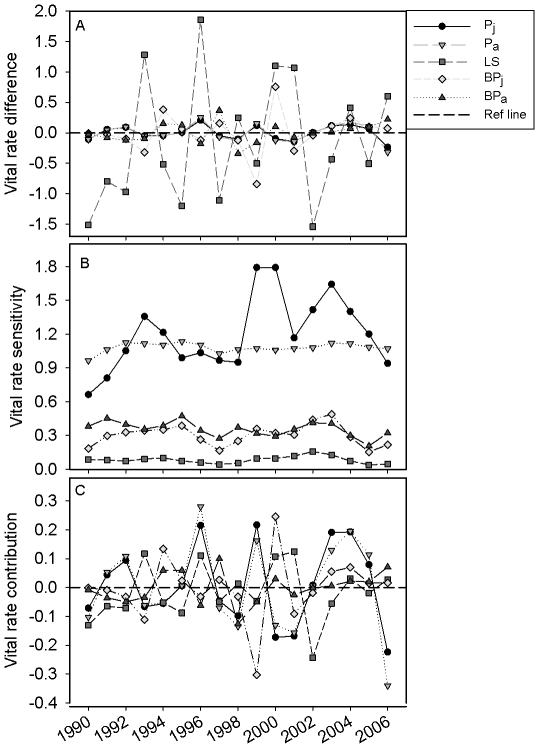
Figure 2. Contributions of vital rates to annual changes in population growth.
Results of life table response experiment (LTRE) analysis: (a) differences in vital rates between consecutive years, (b) sensitivity of the deterministic population growth rate to changes in vital rates, evaluated at the midpoint between two successive years being compared, and (c) LTRE contribution of each vital rate to year-to-year changes in the deterministic population growth rate. Vital rates are: Pj = juvenile survival, Pa = adult survival, LS = litter size, BPj = breeding probability (i.e., probability of successful reproduction) for yearlings, and BPa = breeding probability for adults.

