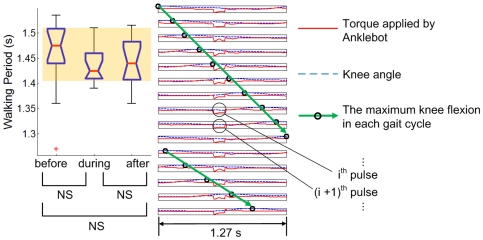
Figure 4. Typical results of a gait that did not entrain to “fast” perturbation (τP<τ0).
The box plot shows the distribution of walking periods of the last 15 strides before perturbation, the last 15 strides during perturbation and the first 15 strides after the end of perturbation. The knee angle and the torque pulse imposed by Anklebot during the last 15 perturbation periods are plotted next to the box plot; each row indicates knee angle (the dotted blue curve) and Anklebot torque profile (the solid red curve) during one perturbation cycle. For each cycle, the phase of maximum knee flexion is identified (the black circle) and the trend of the maximum knee flexion phase is visualized by a green arrow. Stride duration (shown in the box plot) did not change significantly due to the mechanical perturbations, and the phase of maximum knee flexion drifted continuously relative to the perturbation.

