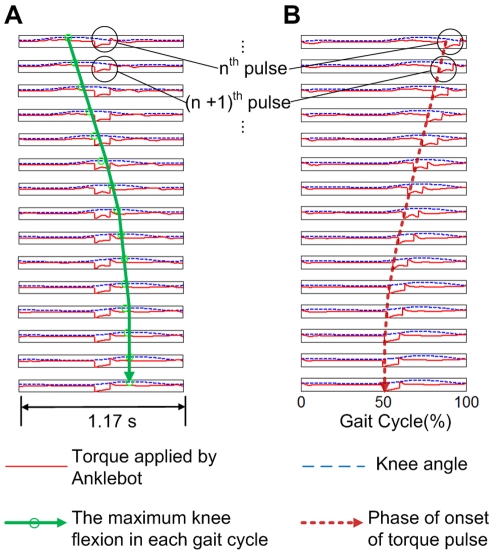
Figure 7. Transient behavior under perturbation.
A shows the knee angle (the dotted blue curve), Anklebot torque profile (the solid red curve), and maximum knee flexion phase (the green circle and arrow) during the last 15 perturbation cycles, and B shows knee angle and Anklebot torque profile with the onset of torque pulse marked (the dotted brown arrow) during the last 15 gait cycles under perturbation. In A, the maximum knee flexion which should occupy an almost constant phase of gait cycle drifted initially but converged on a specific phase of the perturbation cycle. The convergence is also shown in B; the onset of torque pulse drifted initially, but converged on a specific phase of the gait cycle, which is close to 50%.

