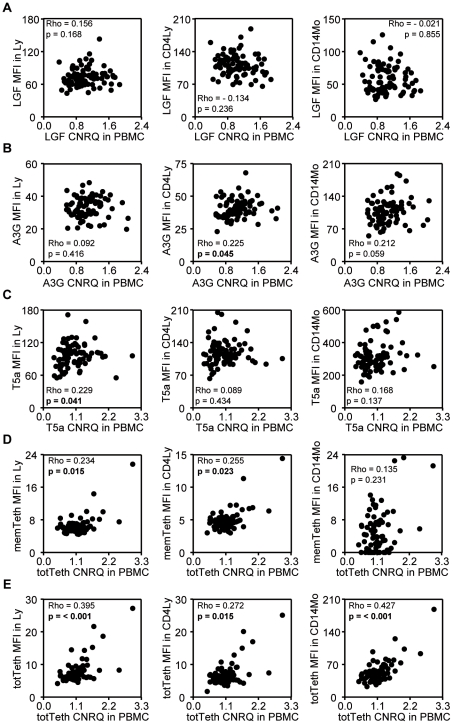
Figure 1. Correlations between mRNA and protein levels.
Correlation patterns were studied in all study subjects between mRNA (CNRQ-values, x-axis) and protein (MFI-values, y-axis) levels of (A) LEDGF/p75 (LGF), (B) APOBEC3G (A3G), (C) TRIM5α (T5a), (D) membrane tetherin (memTeth), and (E) total tetherin (totTeth). mRNA levels were studied in PBMC while protein levels were analyzed in lymphocytes (Ly, left), CD4+ lymphocytes (CD4Ly, middle), and CD14+ monocytes (CD14Mo, right). CNRQ-values refer to Calibrated Normalized Relative Quantity of mRNA expression levels and MFI-values refer to Median Fluorescence Intensity of protein expression levels. Spearman's Rho (Rho) and p-values were obtained by non-parametric Spearman's rank correlation tests. P-values below 0.05 are in bold.

