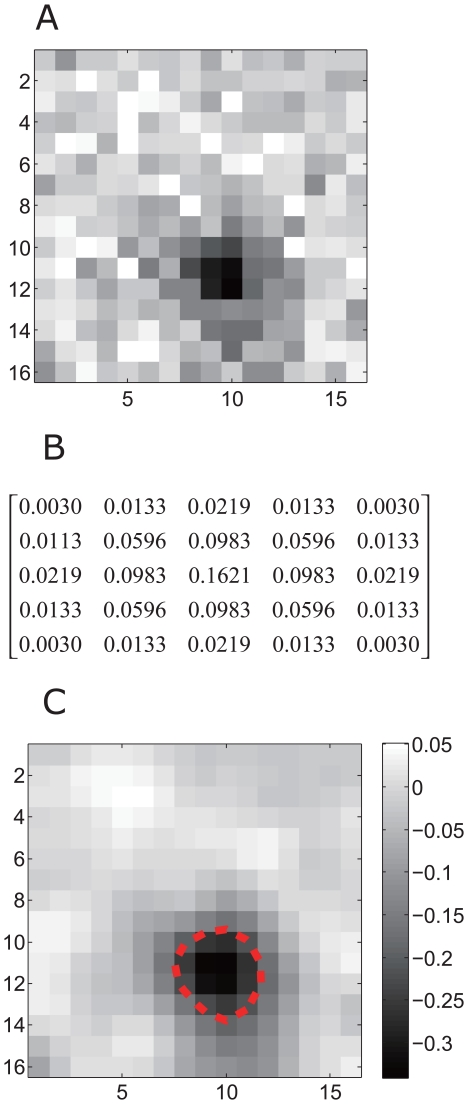
Figure 1. Receptive field of a dimming detector.
A: The raw STA of receptive field map. B: The corresponding 5×5 matrix for the Gaussian filter with standard deviation of 1. C: The receptive field was smoothed using a 2-dimensional Gaussian filter, which removed high frequency noise in the original data. The dash-line indicates the estimated boundary of the receptive field.

