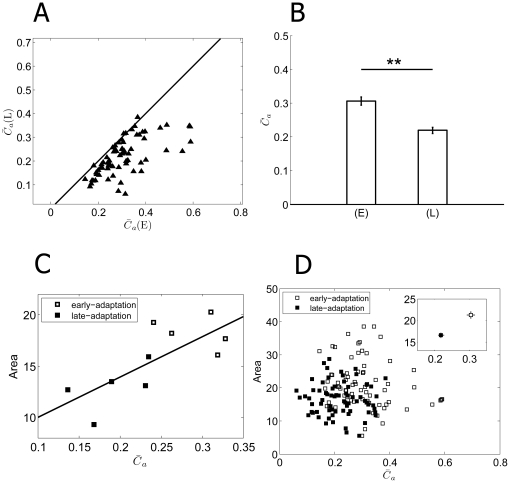
Figure 4. Adaptation-dependent synchronization.
A:  for 70 neurons in early-adaptation (
 (E)) and late-adaptation (
 (L)). (E) = early-adaptation; (L) = late-adaptation. B: The averages
  (E) and
  (L) values for the 70 neurons (
 (E) = 0.31±0.01,
  (L) = 0.22±0.01, mean ± S.E., n = 70, **, p<0.01, paired t-tests). C: RF area vs
  of a retina. Open squares: early-adaptation; filled squares: late-adaptation. The fitted line demonstrates a linear correlation between
  and RF area values. D: RF area vs
  of all the 70 RGCs from 10 retinas.

