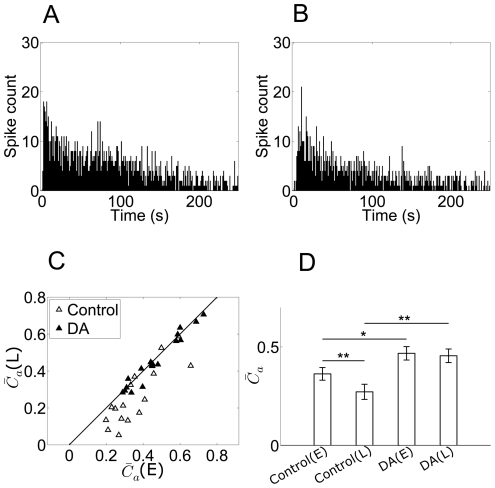
Figure 5. Firing rate and synchronization when DA applied.
A&B: Time-dependent firing rate of an example dimming detector during control and DA application, respectively (bin = 1 s); C: The comparison of synchronization strength calculated based on data recorded during early- and late-adaptation during control (open triangles) and DA application (filled triangles). (E) = early-adaptation; (L) = late-adaptation; D: bar plots show mean  and error bars represent S.E.. Significant differences (based on paired t-tests) are marked by asterisks (*, p<0.02; **, p<0.01).

