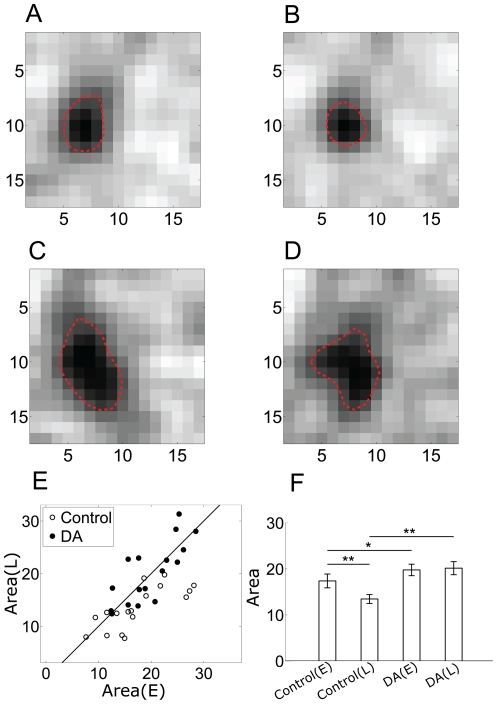
Figure 6. Receptive field under DA condition.
(A–D) The receptive area of a dimming detector in early- and late-adaptation under control condition (A&B) and DA condition (C&D). E; Area(E) vs Area(L) in control (open circle), Area(E) vs Area(L) in DA (filled circle). (E) = early-adaptation; (L) = late-adaptation. F: Bar plots show mean Area and error bars represent S.E. Significant differences (based on paired t tests) are marked by asterisks (*, p<0.02; **, p<0.01).

