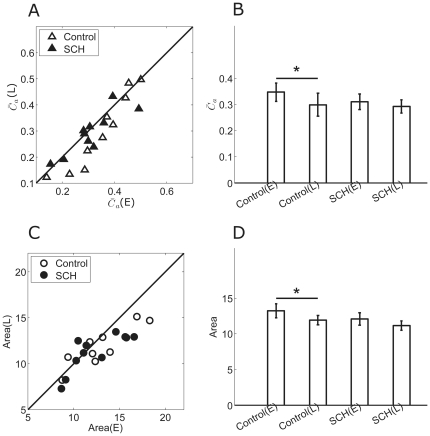
Figure 8. The synchronization index and RF changes measured during SCH-23390 application.
A: The comparison of synchronization index in early- and late-adaptation during control (open triangles) and SCH application (filled triangles). SCH = SCH-23390. B: Bar plots showing mean synchronization index for control and SCH-23390 respectively (mean ± S.E., paired t-test, *, p<0.05). (E) = early-adaptation; (L) = late-adaptation. C: The comparison of RF in early- and late-adaptation for control (open circles), SCH-23390 (filled circles). D: Bar plots showing mean RF area for control and SCH-23390 respectively (mean ± S.E., paired t-test, *, p<0.05).

